brew install elasticsearchMy last post was about NgxLogger and its logging capabilities. One of the reason I chose NgxLogger was that I liked the possibility to send my logs through a url in a Json format. This post is about my experiment with Ngxlogger, Elasticsearch and Kibana.
In order to start aggregating the logs we have to setup Elasticsearch and Kibana.
-
Elasticsearch :
-
Kibana :
brew install kibanaAnd start them.
-
Elasticsearch :
elasticsearch-
Kibana :
kibanaTo check that Elasticserach and Kibana are up and running you can use these urls :
| Elasticsearch | Kibana |
|---|---|
For Elasticsearch, you should see something like this :
{
  "name" : "1jNjpqn",
  "cluster_name" : "elasticsearch_XXXXXX",
  "cluster_uuid" : "_r8CXNRLRsaUhMmdCzDhJxw",
  "version" : {
    "number" : "6.1.2",
    "build_hash" : "5b1fesa5",
    "build_date" : "2018-01-10T02:35:59.208Z",
    "build_snapshot" : false,
    "lucene_version" : "7.1.0",
    "minimum_wire_compatibility_version" : "5.6.0",
    "minimum_index_compatibility_version" : "5.0.0"
  },
  "tagline" : "You Know, for Search"
}
For Kibana, you should see the Kibana app in your browser.
Now we have to modifiy the @NgModule where NgxLogger is defined and do the following.
imports: [
        LoggerModule.forRoot({
            serverLoggingUrl: 'http://localhost:9200/daycare/logs',
            level: NgxLoggerLevel.DEBUG,
            serverLogLevel: NgxLoggerLevel.DEBUG
        }),
        ...
],| serverLoggingUrl | level | serverLogLevel |
|---|---|---|
Url where to send the logs in Json format in our case Elasticsearch |
The logging level in the browser console |
The logging level of the logs to send to the server |
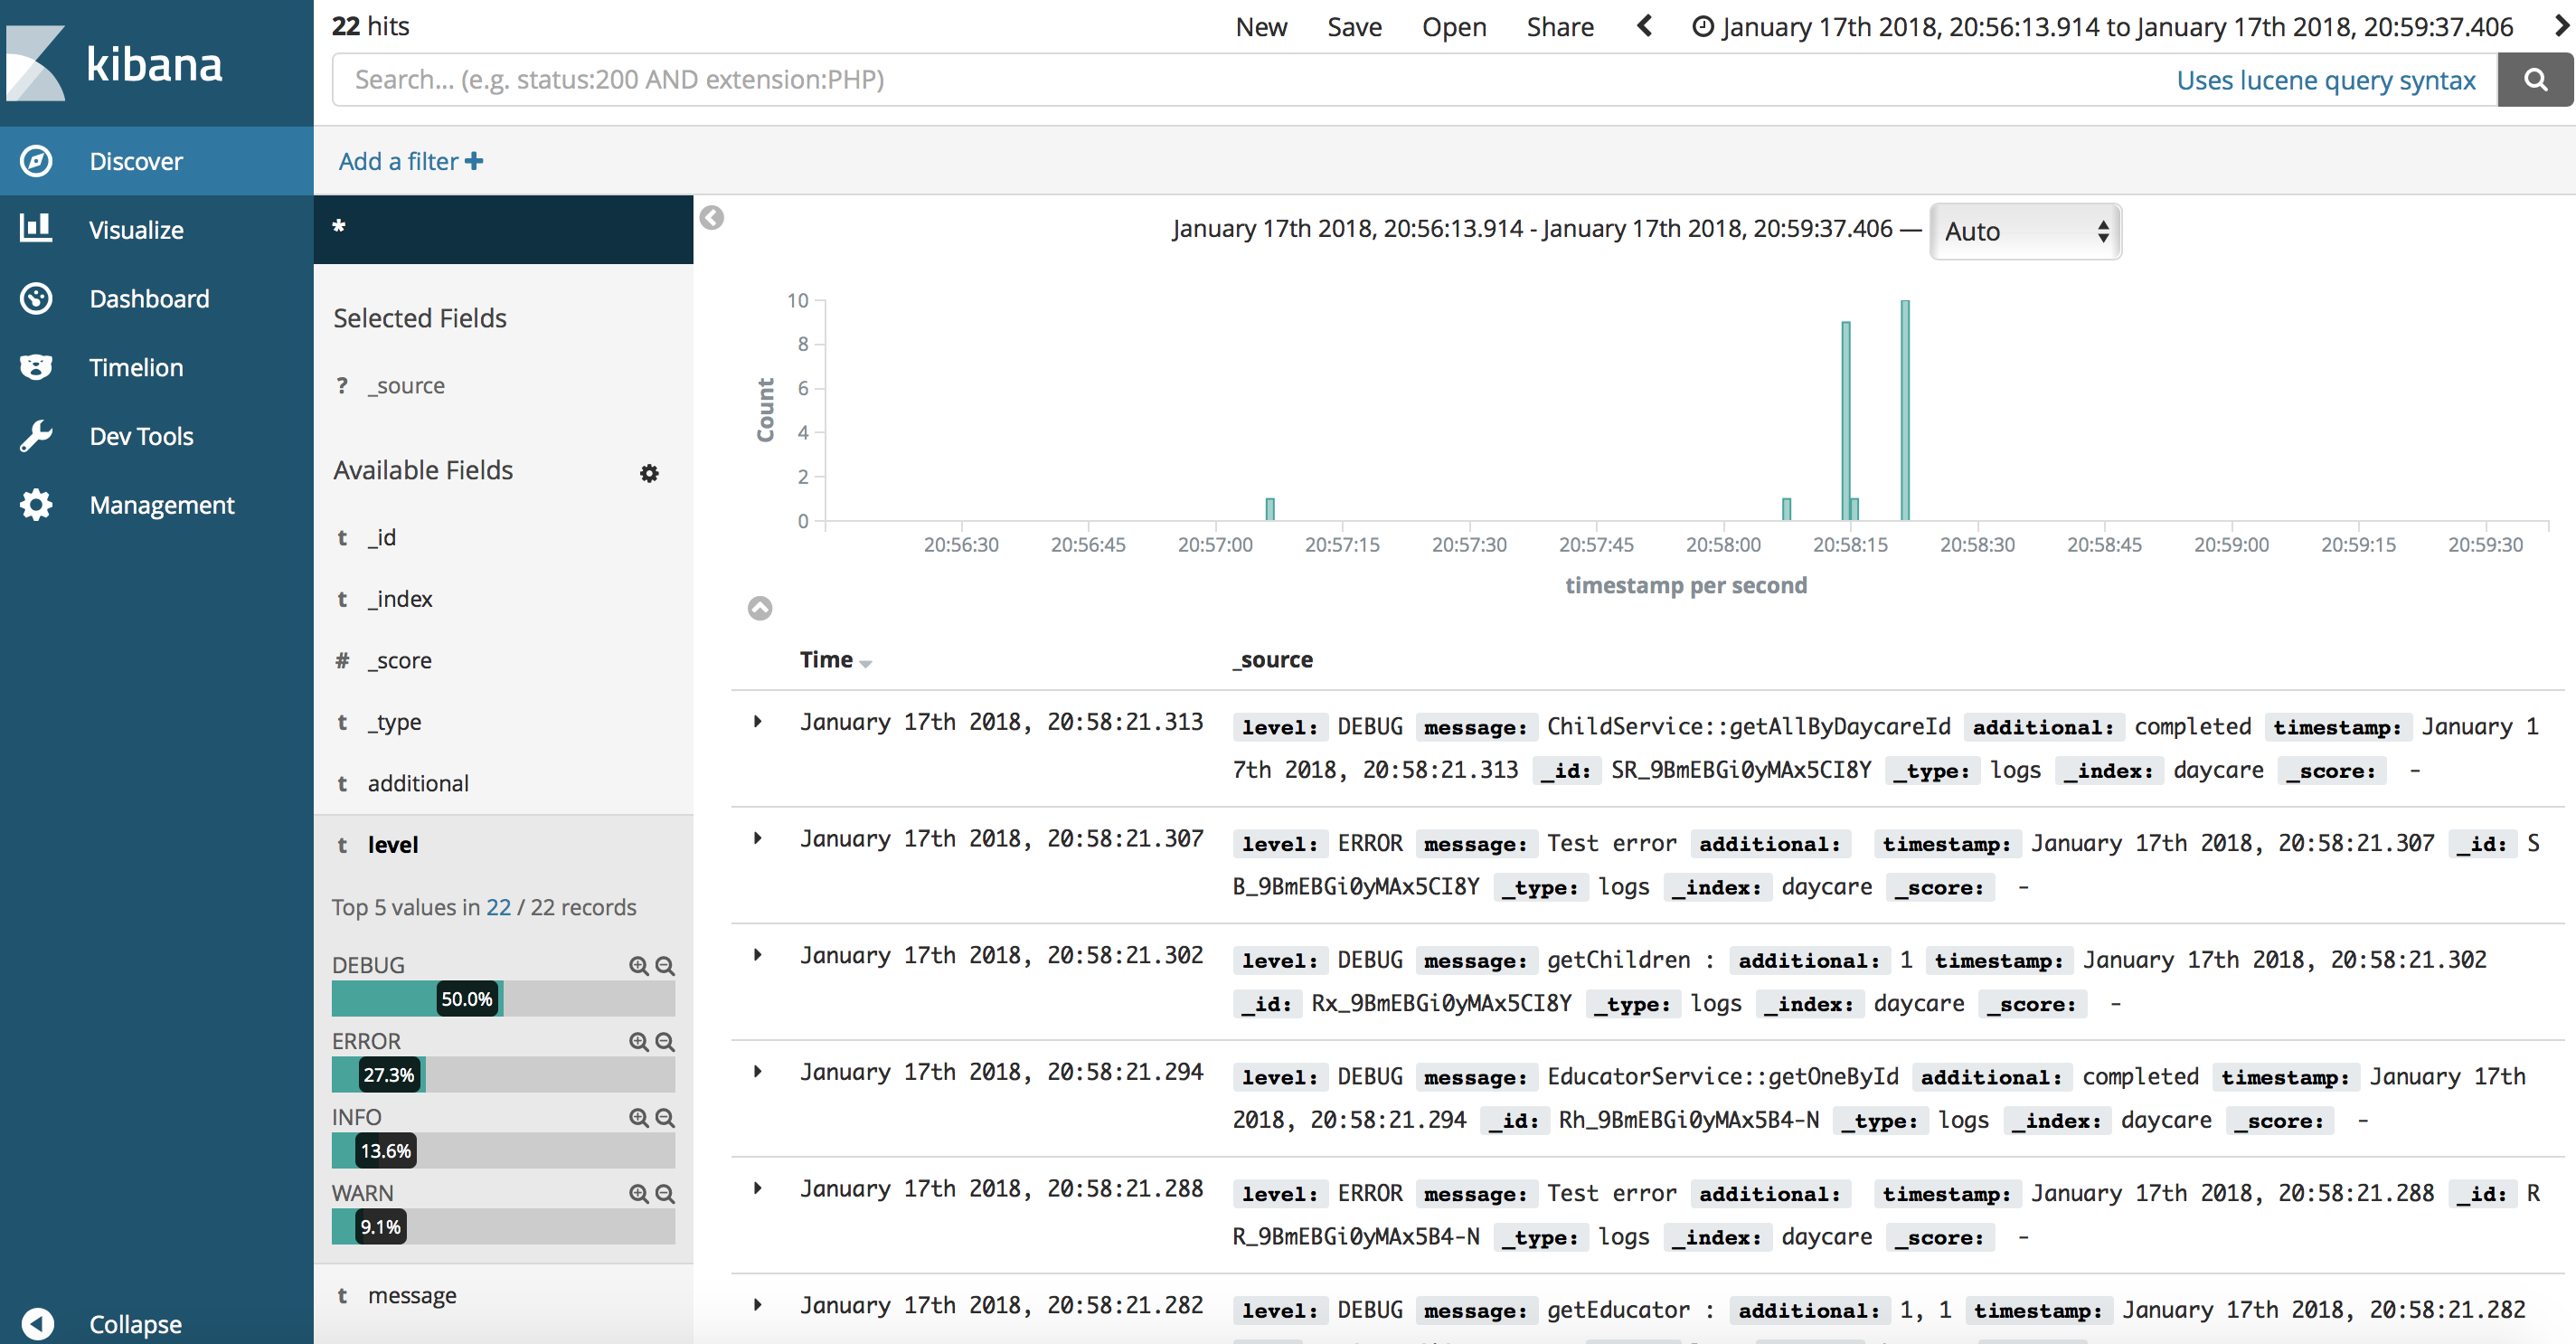
So far, so good, now we have to use our app for a while and go to Kibana to see the result.